Introduction to Business Statistics & Statistics – Table of contents
♦ Introduction of Business Statistics and Statistics
- Meaning of Statistics
- Definition of Statistics
- Purpose of Statistics
- Objectives of Statistics
- Characteristics of Statistics
- Functions of Statistics
- Scope and Importance and Applications of Statistics
- Statistics and State
- Statistics and Business
- Statistics and Economics
- Statistics and Physical Sciences
- Statistics and Natural Sciences
- Statistics and Research
- Statistics and Planning
- Statistics and Industry
- Statistics and Mathematics
- Statistics and Medical Science
- Statistics and Psychology & Education
- Applications of Statistics in Business and Management
- Limitations of Statistics
- Misuse of Statistics
- Distrust of Statistics & Remedies to Remove Distrust
- Nature of Statistics: State whether the Statistics is a Science or Art?
♦ Data Collection
- Data & Statistical Data
- Types of Data
- Collection of Data
- Sources and Methods of Data Collection
- Primary Data
- Secondary Data
- Internal Data
- Methods / Sources of collection of Primary and Secondary Data
- Difference between Primary and Secondary Data
- Questionnaire:
- Introduction, Definition & Objective or Purpose
- Qualities or Characteristics of a Good Questionnaire
- Points to keep in mind while preparing the Questionnaire
- Types of questions in a Questionnaire to be avoided
- Applications / Importance / Uses of Questionnaires
- Advantages and Disadvantages (Limitations) of Questionnaires
♦ Data: Classification, Tabulation & Graphical Representation
Classification of Data
- Classification of Data: Introduction, Definition, Meaning, Cross-Classification
- Objectives / Purpose of Classification of Data
- Functions of Classification of Data
- Steps to an Effective and Successful Data Classification
- Types of Classification
- Principle of Data Classification
- Guidelines for Data Classification
- Uses of Classification of Data
Tabulation of Data
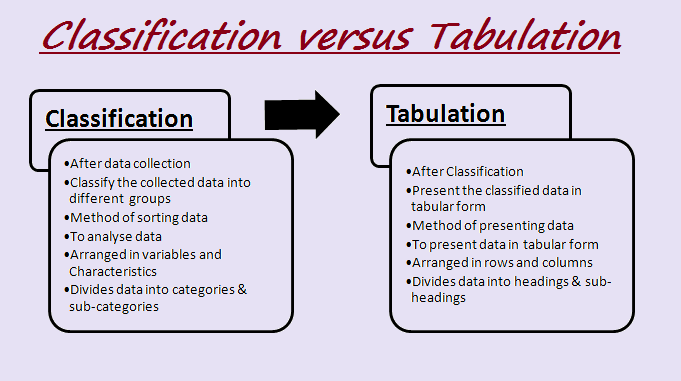
Difference between Classification and Tabulation
Graphical Representation of Data
- Frequency Distribution
- Graphs of Frequency Distributions
- Histogram
- Frequency Polygon
- Smoothed Frequency Curves
- Ogives or Cumulative Frequency Curves
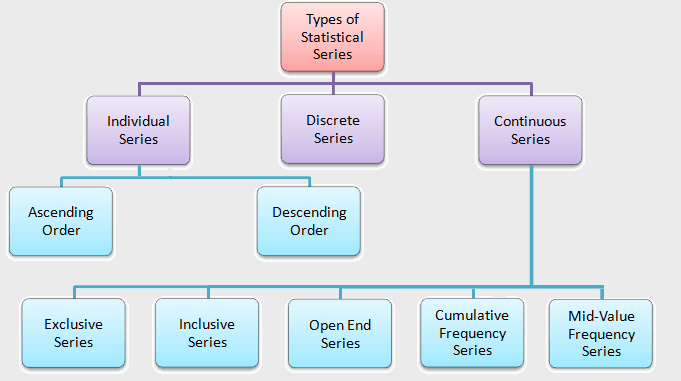
♦ Statistical Series
♦ Measures of Central Tendency
♦ Measures of Variations
♦ Correlation & Regression Analysis
- Correlation
- Significance of the study of Correlation / Utility of Correlation
- Difference between Correlation and Causation
- Types of Correlation
Copyrighted Material © 2019 - 2024 Prinsli.com - All rights reserved
All content on this website is copyrighted. It is prohibited to copy, publish or distribute the content and images of this website through any website, book, newspaper, software, videos, YouTube Channel or any other medium without written permission. You are not authorized to alter, obscure or remove any proprietary information, copyright or logo from this Website in any way. If any of these rules are violated, it will be strongly protested and legal action will be taken.


Be the first to comment