Discrete Series in Statistics with Example:
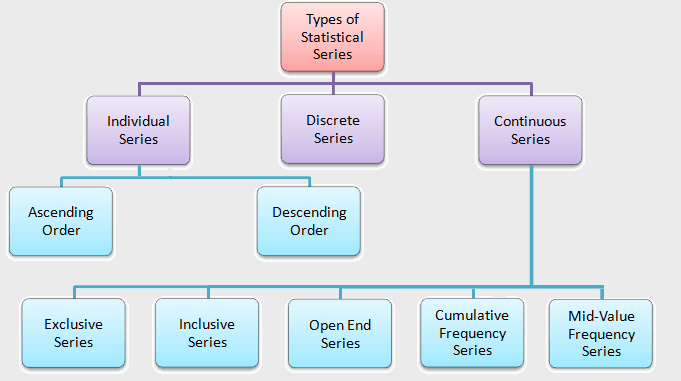
In Statistics, discrete Series are a kind of Statistical Series. The term “discrete series” or “ungrouped frequency distribution” refers to the same thing. When the values are mostly repeated, we may create a series that shows the various values of the variable together with the number of times each value has been repeated. A series of this type is called a discrete series.
Hence, a discrete series is one in which a variable’s frequencies are shown without class intervals. We get X and f in this series, where f is the frequency of X indicating how many times X is repeated.
Example: The following table shows the marks scored by 40 students in an exam.
|
Marks (X) |
No. of Students (Frequency f) |
|
75 |
9 |
|
80 |
5 |
| 63 |
11 |
| 40 |
8 |
| 85 |
7 |
This table clearly shows that 9 students score 75, 5 students score 80, and so on.
Remember that, in the discrete series, no value or item is written more than once. We can write each value only once. When a value occurs repeatedly, the number of times that value appears is defined as the frequency of that value. Hence, data for each distinct value of a variable can be given via a discrete series.
The main feature of a discrete series is that the variables in the series have integer values. The data is displayed in such a way that the actual measurement of each item is clearly visible.
How to create a discrete series:
When creating discrete series from individual series or raw data, apply the following steps:
- First, write all of the distinct variable’s values in the first column (X-column). It is preferable to arrange values or items in ascending order.
- Then put a tally mark for each item or value against the corresponding variable in the second column.
- After that, count the total number of tally bars, and enter a numerical value as the frequency, in the third column.
In other words, to create discrete series, start with writing all of the variable’s values in the first column (X-column), then count how many times each value is repeated and write this number against the corresponding variable in the second column heading frequency (f-column). This type of data representation is also known as a discrete frequency distribution.
Example of a Discrete Series:
The following are the marks scored by the 20 students in a class out of a total of 100. If the marks scored by the 20 students in the class are given individually, it will form an Individual series, as shown follows:
90, 55, 35, 78, 51, 57, 60, 55, 55, 85, 78, 90, 35, 40, 60, 55, 60, 60, 55, 20.
This data can be represented in discrete series or in ungrouped frequency distribution as follows:
|
Marks (X) |
No. of Students (Frequency f) |
|
20 |
1 |
|
35 |
2 |
|
40 |
1 |
|
51 |
1 |
| 55 |
5 |
| 57 |
1 |
| 60 |
4 |
| 78 |
2 |
| 85 |
1 |
| 90 |
2 |
| Total |
20 |
Discrete Series in Statistics with Example in Hindi
असतत श्रृंखला या अवर्गीकृत आवृत्ति वितरण या खंडित आवृत्ति वितरण (Discrete Series in Statistics):
असतत श्रृंखला एक प्रकार की सांख्यिकीय श्रृंखला है। “असतत श्रृंखला” या “अवर्गीकृत आवृत्ति वितरण”, दोनों शब्दों का मतलब एक ही है। जब मान कई बार दोहराए जाते हैं, तो हम एक श्रृंखला बना सकते हैं जो चर के विभिन्न मानों को एक साथ रखते हुए दिखाती है कि प्रत्येक मान को कितनी बार दोहराया गया है। इस प्रकार की श्रृंखला को असतत श्रृंखला कहा जाता है।
इसलिए, एक असतत श्रृंखला वह श्रृंखला है जिसमें एक चर की आवृत्तियों को बिना वर्ग अंतराल के दिखाया जाता है। हम इस श्रृंखला में X और f प्राप्त करते हैं, जहां f, X की आवृत्ति है जो दर्शाता है कि X को कितनी बार दोहराया गया है।
उदाहरण: निम्न तालिका एक परीक्षा में 40 छात्रों द्वारा प्राप्त अंकों को दर्शाती है।
|
अंक (X) |
छात्रों की संख्या (आवृत्ति f) |
|
75 |
9 |
|
80 |
5 |
| 63 |
11 |
| 40 |
8 |
| 85 |
7 |
यह तालिका स्पष्ट रूप से दिखाती है कि 9 छात्रों ने 75 अंक, 5 छात्रों ने 80 अंक, आदि प्राप्त किये है।
याद रखें , कि असतत श्रृंखला में, कोई भी मूल्य या मान या वस्तु एक से अधिक बार नहीं लिखी जाती है। हम प्रत्येक मान को केवल एक बार लिख सकते हैं। अर्थात, अवर्गीकृत आवृत्ति वितरण में प्रत्येक मान को बार-बार नहीं लिखते है बल्कि समान मान की राशियों को एक साथ वर्गीकृत करते हैं। जब कोई मूल्य या मान बार-बार आता है, तो मान के प्रकट होने की संख्या को उस मान की आवृत्ति के रूप में परिभाषित किया जाता है। इसलिए, एक असतत श्रृंखला चर के प्रत्येक विशिष्ट मान के लिए डेटा देती है।
असतत श्रृंखला की मुख्य विशेषता यह है कि श्रृंखला में शामिल चरों में पूर्णांक मान होते हैं। डेटा को इस तरह से प्रदर्शित किया जाता है कि प्रत्येक आइटम (वस्तु) का सटीक माप स्पष्ट रूप से दिखाई दे।
असतत श्रृंखला कैसे बनाएं (How to create a discrete series):
कच्चे डेटा या व्यक्तिगत श्रृंखला से असतत श्रृंखला बनाते समय, निम्न चरणों (steps) को लागू करें:
- सबसे पहले, पहले कॉलम (X – कॉलम) में सभी अलग-अलग संभव चरों के मानों को लिखें। मूल्यों या वस्तुओं को आरोही क्रम में व्यवस्थित करना बेहतर है।
- फिर दूसरे कॉलम में संबंधित चर के सामने प्रत्येक आइटम या मान के लिए टैली मार्क्स लगाएं, (जैसे ही कोई संख्या उस चर के अंतर्गत सामने आती है वैसे ही दूसरे कॉलम में उस संख्या के सामने एक रेखा खींच दी जाती है, इस प्रकार चार रेखाएं खींचने के बाद पांचवी रेखा से पहले खींची गयी चारो रेखाओं को काट दिया जाता है। इस प्रकार प्रत्येक संख्या के सामने पांच-पांच रेखाओं के समूह बन जाते है जिनको गिनकर उस संख्या की कुल आवृत्ति ज्ञात कर सकते है। )
- उसके बाद, टैली बार की कुल संख्या गिनें, और तीसरे कॉलम में, आवृत्ति के रूप में एक संख्यात्मक मान दर्ज करें।
दूसरे शब्दों में, असतत श्रृंखला बनाने के लिए, शुरूआत सभी चरों के मानों को पहले कॉलम (X – कॉलम) में लिखने के साथ करें, फिर गिनती करें कि प्रत्येक मान कितनी बार दोहराया गया है और दूसरे कॉलम (f – कॉलम, जिसका शीर्षक आवृत्ति है) में संबंधित चर के सामने इस संख्या को लिखें। इस प्रकार के डेटा निरूपण को असतत आवृत्ति वितरण के रूप में भी जाना जाता है।
असतत श्रृंखला का उदाहरण (Example of a Discrete Series):
एक कक्षा में कुल 100 में से 20 छात्रों द्वारा प्राप्त किये गए अंक निम्नलिखित हैं। यदि कक्षा में 20 छात्रों द्वारा प्राप्त अंक अलग-अलग दिए गए हैं, तो यह एक व्यक्तिगत श्रृंखला का निर्माण करेगा, जैसा कि नीचे दिखाया गया है:
90, 55, 35, 78, 51, 57, 60, 55, 55, 85, 78, 90, 35, 40, 60, 55, 60, 60, 55, 20.
इस डेटा को असतत श्रृंखला में या अवर्गीकृत आवृत्ति वितरण में निम्नानुसार दर्शाया जा सकता है:
|
अंक (X) |
छात्रों की संख्या (आवृत्ति f) |
|
20 |
1 |
|
35 |
2 |
|
40 |
1 |
|
51 |
1 |
| 55 |
5 |
| 57 |
1 |
| 60 |
4 |
| 78 |
2 |
| 85 |
1 |
| 90 |
2 |
| Total |
20 |
(Source – Various books from the college library)
Tags: write an example with the solution of discrete series in statistics
Copyrighted Material © 2019 - 2024 Prinsli.com - All rights reserved
All content on this website is copyrighted. It is prohibited to copy, publish or distribute the content and images of this website through any website, book, newspaper, software, videos, YouTube Channel or any other medium without written permission. You are not authorized to alter, obscure or remove any proprietary information, copyright or logo from this Website in any way. If any of these rules are violated, it will be strongly protested and legal action will be taken.


Be the first to comment