Types of Data (Qualitative and Quantitative Data):
To move a business on the right track, data acts like fuel. It provides meaningful information that can be used to improve the strategy of current campaigns. It can be used to easily manage the launch of new products, or it can be used differently.
When data is so important in our lives, it is essential that it is correctly stored and processed without any error. When working with datasets, the type of data plays a vital role in determining which preprocessing method would yield the best results for a specific set or which form of statistical analysis should be used to achieve the best results.
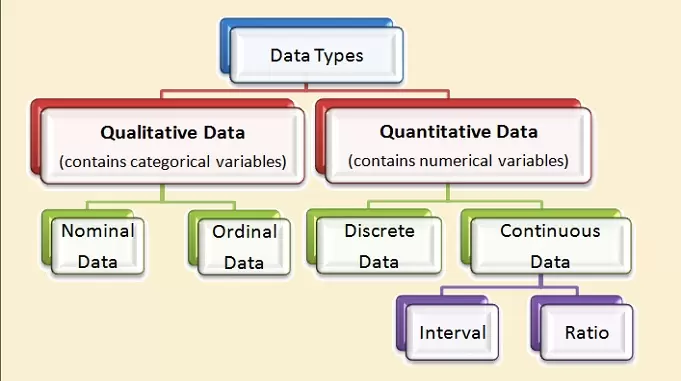
Data can be descriptive (characteristics) or numerical (numbers). Let us take a look at some of the most prevalent data types. There are two types of data: Qualitative and Quantitative Data.
(A) Qualitative Data:
Qualitative Data are not numbers.
There are no numbers in qualitative data, so it cannot be measured. It is also called Categorical Data because the data can be sorted by category rather than by number.
Qualitative data is dealing with characteristics and descriptions that are difficult to measure but may be subjectively observed, e.g., smells, tastes, textures, attractiveness, color, etc. They may include favourite foods, favorite holiday destinations, religions, ethnicities, faiths, words, pictures, symbols, colours, and so on.
These data are described by some characteristics, for example, gender, blood group, etc. Labels or names are used to find the characteristics of each element in qualitative data.
This data can provide answers to questions such as:
“How did it occur?” or “Why did this occur?”
In general, qualitative data can be divided into two types:
- Nominal data
- Ordinal data
1. Nominal Data:
This data type is only used for naming variables and has no numerical value.
Nominal data is often known as “labels.” In other words, nominal data is a collection of values that do not have a natural order.
For example, it is not possible to state that ‘Green’ is greater than ‘Blue’, so we cannot compare one color to another, and so the color of a thing is a nominal data type.
Examples of Nominal Data:
- Colors: (Blonde, Brown, Brunette, Red, etc.)
- Taste: (Sour, Sweet, Salty, Pungent, etc.)
- Languages: (Sanskrit, Hindi, English, Marathi, Gujarati, Tamil, Telugu, etc.)
In these examples, there is no intrinsic order to the variables.
Color is a nominal variable having a few levels or categories, such as Blue, Green, Brown, etc., and there is no possible way to order these categories in a rank-wise manner, i.e., from Best to worst or vice-versa.
Taste is a nominal variable with a few levels or categories, such as Sour, Sweet, Salty, Pungent, and so on, and there is no way to arrange these categories from highest to lowest or vice versa.
2. Ordinal Data:
Ordinal data is defined as qualitative data whose values are ordered.
In this type of data, a natural ordering occurs while maintaining class values. In other words, ordinal data is data that is sorted by its scale position. They may, for example, imply superiority. Ordinal numbers cannot be used for arithmetic because they only display sequence.
For example, we can easily sort the clothing brands’ sizes according to their name tags in the order of small < medium < large.
Examples of Ordinal Data:
- Economic status: (low, medium, high).
- Letter grades: (A, B, C, D, E, etc.)
- Rank in a competition: (First, Second, Third)
- Educational background: (10th, 12th, Graduate, Post Graduate, etc.)
- Time of day: (Morning, Noon, Night)
In these examples, there is an obvious order to the categories. Therefore, Ordinal data is almost the same as nominal data, except that the order is important.
Qualitative data are created for something to be classified or judged.
(B) Quantitative Data:
Quantitative data are numbers.
Numbers make up quantitative data. That is, the data represented in numbers, are quantitative data. Quantitative data is made up of numbers and things that can be measured objectively, e.g., area, volume, height, width, length, weight, speed, humidity, temperature, prices, year, number of pets owned, etc.
Quantitative data is always represented by numbers that indicate either how much or how many.
In general, quantitative data can be divided into two types:
- Discrete data
- Continuous data
1. Discrete Data:
Discrete data is counted, but it can only have certain values.
Discrete data consists of finite, numeric, countable, and non-negative integers with discrete variables. Generally, it involves integers. The number of pupils, the number of children, the shoe size, and so on are all examples of discrete data.
Examples of Discrete Data:
- When we roll one die, we obtain 1, 2, 3, 4, 5, or 6 as discrete data. A value of 2.35 is impossible to acquire.
- The total number of students enrolled in a class is discrete data because we cannot have half of a student.
- The number of children (or adults, or pets) in your household is discrete data because you’re counting full, indivisible objects. You cannot have 1.5 kids or 2.3 pets.
- The total number of customers that purchased various things
- Each department’s total number of computers
- The quantity of goods you buy each week at the grocery store.
We can use simple statistical approaches such as bar charts, line charts, and pie charts to depict and demonstrate discrete data.
Discrete data can also be categorical, which means that it has a limited number of data values, such as a person’s gender. Discrete distributions make it easier to analyse discrete values.
2. Continuous Data:
Continuous data is measured, and its value can be anything within a range.
Continuous data is a set of numbers that can have any decimal or fractional value. Complex numbers and fluctuating data values that are measured over a defined time frame are also included in it. Height, weight, length, time, temperature, and age are all instances of continuous data.
For example, The height of a person may be precisely 5.78 feet. Your speed does not jump from 5 mph to 6 mph; instead, it passes through every decimal point in between, such as 5.4 mph.
In other words, continuous data might be divided and refined to more fine levels.
For example, we can measure someone’s height in meters, centimetres, millimetres, and so on, so height is continuous data.
Examples of continuous data:
- Newborn babies’ body weight
- A freezer temperature
- The wind speed
Continuous data can be further classified as measured on an interval scale or a ratio scale.
(i) Interval Scale:
Values that do not have a natural zero are referred to as the interval scale.
An interval scale has order and the difference between two values is significant. You cannot make a ratio out of these numbers, such as the temperature of a room in Celsius.
Temperature, pH, and credit score are examples of interval variables.
(ii) Ratio Scale:
A ratio scale is a set of values that have a natural zero.
Something measured on a ratio scale has the same properties as something measured on an interval scale, with the exception that there is an absolute zero point with ratio scaling. In other words, a ratio variable contains all of the attributes of an interval variable, plus a distinct definition of 0.0. There is no value for the variable when it equals 0.0.
- An example is a temperature measured in Kelvin. Below 0 degrees Kelvin, there is no value possible; it is absolute zero.
- Another example is weight; 0 kg indicates a notable absence of weight.
Most of the time, when we collect data, we try to collect quantitative data so that we can draw better conclusions from the data.
(Source – Various books from the college library)
Tags: qualitative and quantitative types of data in statistics
Copyrighted Material © 2019 - 2024 Prinsli.com - All rights reserved
All content on this website is copyrighted. It is prohibited to copy, publish or distribute the content and images of this website through any website, book, newspaper, software, videos, YouTube Channel or any other medium without written permission. You are not authorized to alter, obscure or remove any proprietary information, copyright or logo from this Website in any way. If any of these rules are violated, it will be strongly protested and legal action will be taken.


Be the first to comment