Data, Information and Statistical Data in Statistics:
We will discuss Data (raw data, discrete data, and continuous data), Information, and Statistical Data, as well as the differences between them, in this article of Statistics.
♦ Data:
Factual information, such as measurements or statistics, that is used as a basis for argument, discussion, calculation, etc., is called data. The data is copious and easily accessible.
In other words, any piece of information that may be expressed as a value or a numerical number is called data.
So, basically, data is a collection of information, observations, or measurements. For example, the number of vehicles that passed through a highway in an hour is data, and the marks you received on your exam is also data.
Raw Data:
The term “raw data” means an initial collection of information, which hasn’t been properly organised yet. We will get raw data, after the very first step of data collection. For example, if we ask a group of five students about their exam scores, and their responses are 8, 9, 7, 10, and 6. This collection of information is called raw data.
Discrete Data:
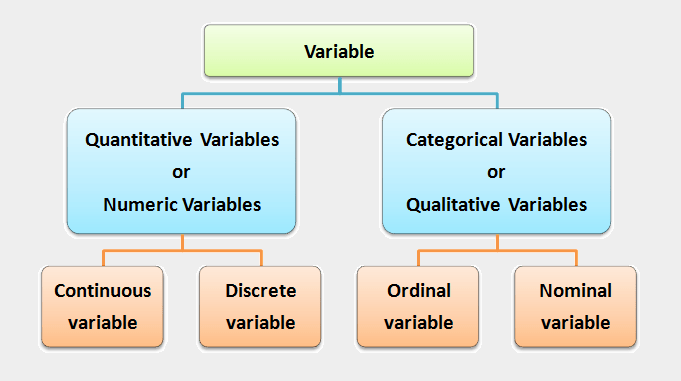
Discrete data is the data that is recorded in whole numbers, such as the number of members in a family or the number of animals in a zoo. Discrete data cannot be in fractions or decimals.
Continuous data:
Continuous data does not have to be expressed in whole numbers; it can also be expressed in decimals. For example, your percentage of marks, the temperature in a city for a week, etc.
♦ Difference between Data and Information:
The words “data” and “information” are frequently interchanged, but between the two there is a tiny difference.
In short, numbers, symbols, characters, words, codes, charts, etc., are called data, whereas information is kept in the context of data. Human beings use the information to make decisions, forecasts, etc.
The main differences between data and information are as follows:
- Data is a collection of unorganised and unprocessed facts. Information is made up of processed, organised data that is presented in a meaningful context.
- Data is a single unit that consists of raw materials that have no special meaning. Information is a collection of data that has a logical meaning when taken together.
- Data is not dependent on information, but the information is dependent on data.
- Bits and bytes are the units of measurement for data. Time, quantity, and other meaningful units are used to measure information.
- For decision-making, raw data is insufficient. For example, the test score of a student is called data. For decision-making, information is sufficient. For example, the average marks of a class are called information produced from the given data.
♦ Difference between Data and Statistics:
The words “data” and “statistics” are frequently interchanged, but between the two there is an important distinction in scholarly research.
- Data are individual pieces of factual information that are recorded and used for analysis. It is the raw information that creates statistics.
- The results of the data analysis – their interpretation and presentation – are statistics. In other words, some calculation has taken place that gives some understanding of the meaning of the data. Statistics are frequently displayed in the form of a table, chart, or graph, but this is not required.
♦ Statistical Data:
Government agencies often publish data, such as unemployment rates or educational literacy rates. These kinds of data are called “statistical data”.
Hence, statistical data is a sequence (collection) of observations made on a group of items that are part of a population sample. Statistical data or data can be presented in the following two forms-
(1) Ungrouped Data:
Raw data or ungrouped data are data that have not been arranged in a systematic fashion.
Ungrouped data, also called raw data, is data that has not been put into a group or category after collection. Data is classified into numbers or attributes (characteristics), so data that is not placed in either category is called ungrouped data.
When collecting data, priority is given to ungrouped data, as it contains the information in its original form.
(2) Grouped Data:
Data in the form of a frequency distribution is called grouped data.
Data that has been classified into groups after it has been collected is called grouped data. The raw data is organised into many groups and a table is made. The table’s main purpose is to show the data points that appear in each group. For example, when a test is completed, the results are the data in this situation, and there are many methods for grouping this data.
(Source – Various books from the college library)
Copyrighted Material © 2019 - 2024 Prinsli.com - All rights reserved
All content on this website is copyrighted. It is prohibited to copy, publish or distribute the content and images of this website through any website, book, newspaper, software, videos, YouTube Channel or any other medium without written permission. You are not authorized to alter, obscure or remove any proprietary information, copyright or logo from this Website in any way. If any of these rules are violated, it will be strongly protested and legal action will be taken.


Be the first to comment