In this article, we will discuss covariance, the covariance formula, and the types of Covariance.
Definition of Measures of Relationship:
In order to better understand finance, we need to have a strong knowledge of statistics. Furthermore, statistical ideas can assist investors in keeping track of their investments.
For some applications, an understanding of the relationship between two variables is required. For example, if an investor wishes to assess the risk of a stock portfolio, it is necessary to measure precisely how closely the returns on the stocks track each other. The statistical measures that demonstrate a relationship between two or more variables are called Measures of Relationship. For example, covariance is a measure of the relationship between two random variables. The statistic measures how much – and to what extent – the variables change in tandem.
If we wish to study if two variables are associated, we want to know whether changes in one variable are related to changes in the other. We say that two variables covary if we notice that when one variable deviates from its mean, the other variable moves away from its mean in the same or opposite direction.
For a graphical representation, a scatter plot is a visual depiction of the association between two variables. And for a mathematical representation, the relationship between the variables can be demonstrated using covariance and correlation coefficients. Hence, two measures of association, that can be used to determine the relationship between two variables, are Covariance and Correlation. The combined difference between the two variables is described by covariance.
Definition of Covariance:
Covariance is a measure of the association between random variables. It is a measure of how much two random variables change together. Covariance is similar to variance, but variance shows how a single variable changes, whereas covariance, describes how two variables change together. The measure, however, does not consider the dependency between variables.
Covariance is a statistical measure of the tendency of two random variables to grow above their means or drop below their means at the same time. That is, covariance is a measure of the tendency of two random variables to change in the same or reverse direction.
In other words, covariance is a measure of the combined variability of two random variables (X, Y). For instance, we take a look at family income and expenditures. Families with high income (say X) will have higher expenditure (say Y), and vice-versa. This type of relationship between two variables is known as combined variability, and it may be measured using Covariance.
The values of covariance are not standardised. As a result, the range of the covariance value can be from negative infinity to positive infinity.
- Sample Covariance: A sample covariance assesses the degree and direction of the relationship between the variables of two samples; where a sample is a randomly chosen selection of items from an entire population.
- Population Covariance: A population covariance assesses the degree and direction of the relationship between two populations’ variables. It is calculated in the same way as the sample covariance.
Covariance Formula:
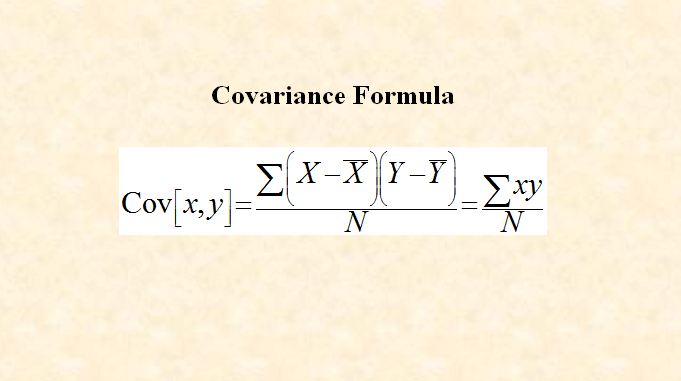
Covariance is represented as Cov[x, y]. The covariance can be Positive, Negative, or Zero. The Covariance is calculated by using the following formula:
where,
N= Number of the items,
X= The values given in the X-variable,
Y= The values given in the Y-variable that corresponds with X-value,
Mean of the X-values,
Mean of the Y-values,
also,
x= the deviations of various items of the X-variable (first variable) from the mean of the X-variable,
y=the deviations of various items of the Y-variable (second variable) from the mean of the Y-variable,
and ∑xy is the sum of products of these corresponding deviations.
Units of Covariance:
Covariance is measured in units. The units are calculated by multiplying the units of the two variables. The covariance might have any positive or negative value.
Types of Covariance:
The covariance might have any positive or negative value. To determine the direction of a relationship between two variables; in other words, to determine whether two variables change in the same or opposite directions, we use covariance. The sign (positive or negative) of the covariance value determines this relationship. Hence, the types of covariance are as follows:
- Positive Covariance
- Negative Covariance
- Zero Covariance or No Covariance
1. Positive Covariance:
A positive covariance between two variables means that both variables tend to increase or decrease at the same time, that is, Positive covariance shows that all variables tend to move in the same direction.
In other words, a positive covariance between variables x and y shows that, if x is greater than the average then y will be also greater than average, and vice versa. The data points will tend to slope upwards on a two-dimensional graph.
For example, assume that a firm notices that increasing research and development expenses leads to a rise in new inventions. In this situation, the covariance between Research and development spending and new inventions would be positive.
Consider another example, family income (X) and expenditures (Y). Families with a high income (say X) will spend more (say Y), and vice versa. In this case, as the value of X increases, so do the corresponding values of Y, and so the covariance between family income and expenditures would be positive.
2. Negative Covariance:
A negative covariance between two variables demonstrates that both variables tend to move in opposite directions. When the estimated covariance is less than zero or negative, the two variables are said to be inversely related.
In other words, a negative covariance between variables x and y shows that, if x is greater than the average then y will be lesser than average, and vice versa. The data points will tend to slope downwards on a two-dimensional graph.
For example, assume that a firm notices that rising labour expenses diminish corporate earnings, then labour expenses and earnings have a negative covariance.
Consider another example, price (X) and demand (Y). In this case, as a commodity’s price (X) rises, then its demand (Y) falls, and so the covariance between price and demand would be negative.
3. Zero Covariance or No Covariance:
If there is no linear relationship between variables X and Y, it is referred to as Zero Covariance or No Covariance. The Zero Covariance indicates that the covariance will be zero or close to zero.
For example, assume that a firm notices that profits are not related to the average daily temperature, then the covariance between profits and average daily temperature will be very close to zero.
(Source – Various books from the college library)
Tags: define covariance and write the covariance formula
Copyrighted Material © 2019 - 2024 Prinsli.com - All rights reserved
All content on this website is copyrighted. It is prohibited to copy, publish or distribute the content and images of this website through any website, book, newspaper, software, videos, YouTube Channel or any other medium without written permission. You are not authorized to alter, obscure or remove any proprietary information, copyright or logo from this Website in any way. If any of these rules are violated, it will be strongly protested and legal action will be taken.


Be the first to comment