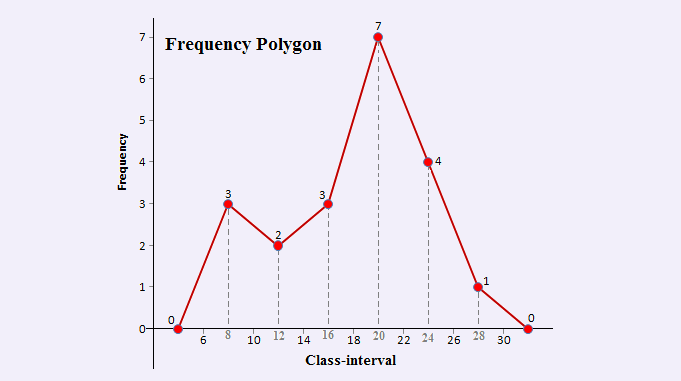
Frequency Polygon & Advantages of frequency polygon over the Histogram
A frequency polygon is a graph of a frequency distribution with more than four sides. The frequency polygon is made up of line segments that connect… […]

A frequency polygon is a graph of a frequency distribution with more than four sides. The frequency polygon is made up of line segments that connect… […]
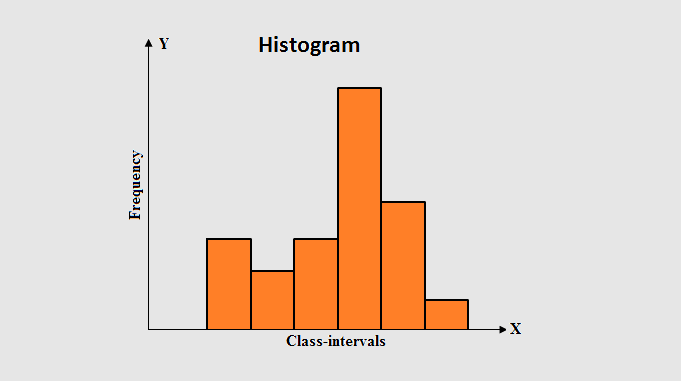
Histogram is a graph that uses vertical adjacent rectangles to show class frequencies in a frequency distribution. […]
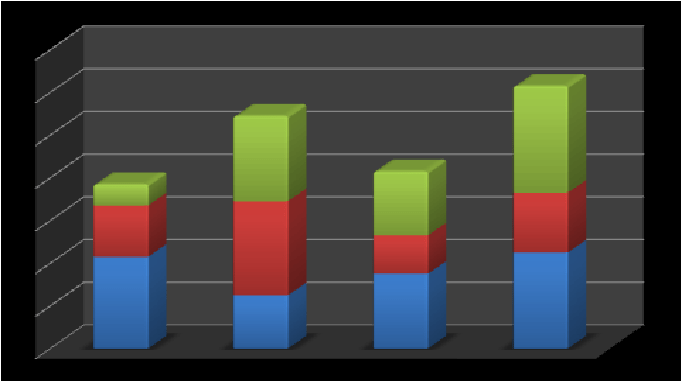
The data in a frequency distribution can be displayed as graphs, which highlight important characteristics and relationships that would be difficult to detect from a simple inspection of the frequency tables […]

Example of frequency distribution:- Construct a frequency distribution from the following data by inclusive method taking… […]

In statistics, a frequency distribution is a graphical or tabular representation, that shows the number of observations within a given interval. […]
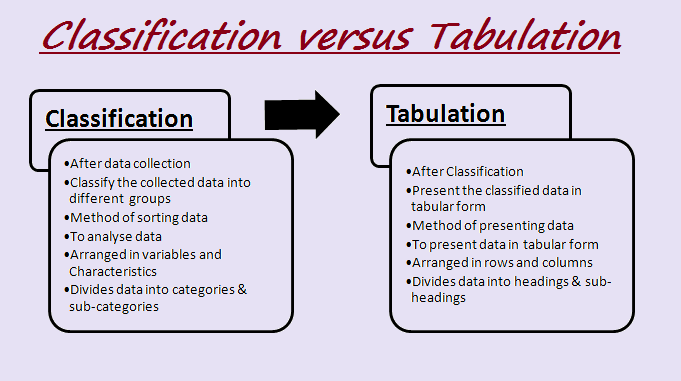
After data collection, the classification process begins, and it is the first step in the tabulation. Only after the classification is completed, the tabulation procedure begin. […]
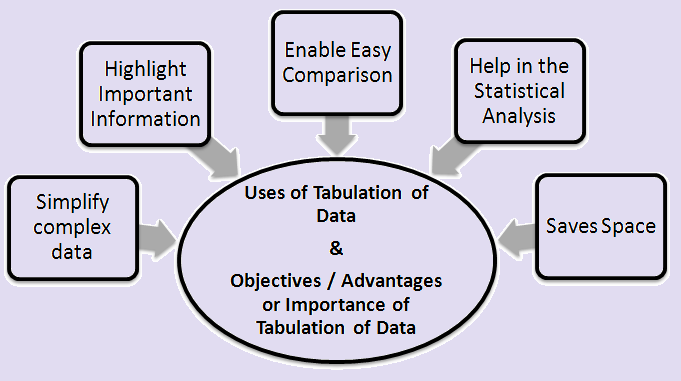
Uses of Tabulation of Data / Objectives & Advantages or Importance of Tabulation of Data Uses of Tabulation of Data: Tabulation, essentially, is a technique for filling the gap between the collection of data and their […]
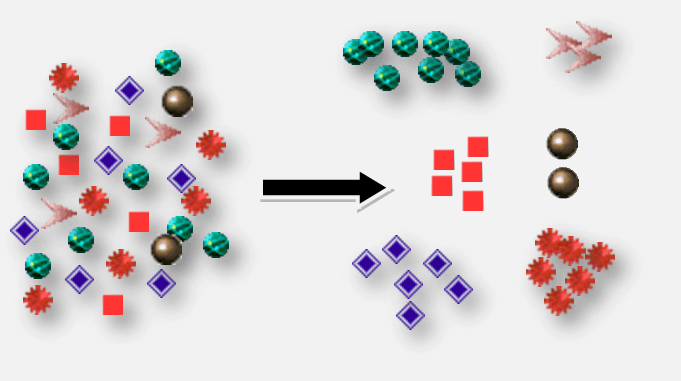
When the data collected is diverse, classification is required for effective presentation and analysis. […]
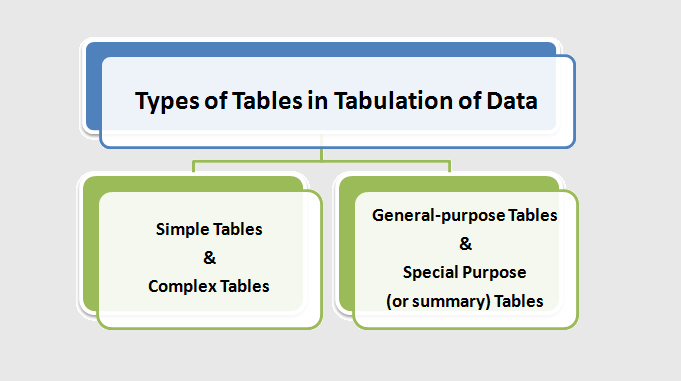
Tables may broadly be classified into categories: Simple and complex tables, General-purpose and special purpose (or summary) tables. […]
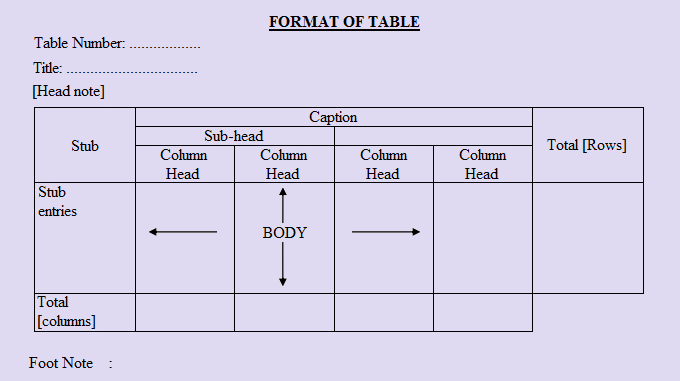
The various parts of a table may change based on the data provided, but a good and decent table must include at least the following parts: […]
Copyright © 2019 - 2024 Prinsli.com - All rights reserved