
Histogram & Difference between Bar graph and Histogram
What is a histogram?
The histogram is one of the most commonly used graphs for charting a frequency distribution.
A histogram is a type of graph that shows the distribution of data. It is the best way to see a simple frequency distribution graphically. It’s a graphical representation of data that uses bars of different heights. That is, a histogram is a graph that shows the distribution of values for a numeric variable as a series of bars. Where a bar’s height represents the frequency of data points with a value within the corresponding class, and each bar’s width covers the range of the class.
The statistical definition of a histogram; “Histogram is a graph that uses vertical adjacent rectangles to show class frequencies in a frequency distribution.”
The word “histogram” should be understood separately from the word “historigram (time-image)” and not the same. A histogram is used to show the frequencies of different types of numbers and classes, but the historigram is related to time charts and used to show the changes over time.
How to construct a histogram:
When creating a histogram, the variable is always placed on the X-axis, and the corresponding frequencies are placed on the Y-axis. After that, each class is represented by a scale distance proportionate to its class-interval.
If the class-intervals are uniform throughout, the distance between each rectangle on the X-axis must be the same; if they are not, the width of the rectangles must change proportionately.
The Y-axis represents the frequencies of each class, which make up the rectangle’s height. We obtain a series of rectangles, each with a class interval distance as its width and a frequency distance as its height. The histogram’s area represents the entire frequency.
Histogram vs Bar Chart (Difference between Bar graph and Histogram):
The difference between a histogram and a bar graph should be obvious.
A bar diagram is one dimensional, meaning that just the length of the bar is important, not the width; however, a histogram is two dimensional, meaning that both the length and the width are important in a histogram.
A histogram, on the other hand, can be misleading if the distribution includes unequal class-intervals and no appropriate adjustments in frequency are done.
Example: Draw a Histogram from the following data:
| 16 | 21 | 9 | 23 | 19 | 23 | 20 | 23 | 18 | 9 |
| 19 | 29 | 20 | 13 | 10 | 23 | 20 | 15 | 11 | 19 |
Solution: To sketch a histogram, first divide the data into classes, where each class has the same width.
Step 1: First, arrange the original data set in ascending order as follows:
| 9 | 9 | 10 | 11 | 13 | 15 | 16 | 18 | 19 | 19 |
| 19 | 20 | 20 | 20 | 21 | 23 | 23 | 23 | 23 | 29 |
Step 2: Divide the data into classes:
Here, the smallest and largest numbers in this data are 9 and 29, respectively. If we choose 6 classes, then the class width will be,
Class width ≈ (Largest data value – Smallest data value)/( Number of classes) = (29 – 9)/6 = 3.33,
which round up to 4.
We choose 6 classes of width 4 starting at 6.5, and add successively the class width of 4 to get other class boundaries.
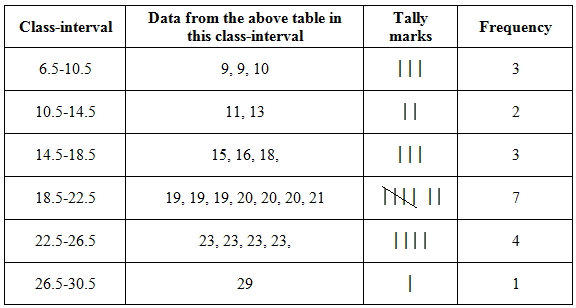
Step 3: Next, make a tally of the number of data values for each class.
The numbers are grouped into the classes 6.5-10.5, 10.5-14.5, and so on, as shown in the following frequency distribution table:
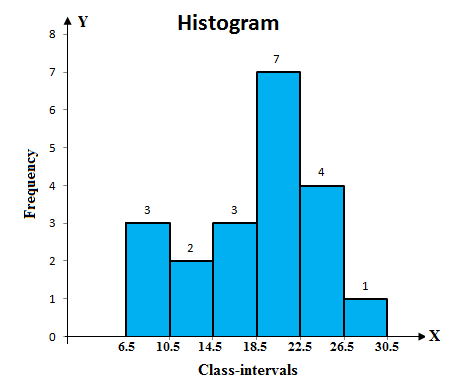
Step 4: Then, sketch the histogram using these above frequencies. The histogram for the original data is shown in the following figure:
(Source – Various books from the college library)
Copyrighted Material © 2019 - 2024 Prinsli.com - All rights reserved
All content on this website is copyrighted. It is prohibited to copy, publish or distribute the content and images of this website through any website, book, newspaper, software, videos, YouTube Channel or any other medium without written permission. You are not authorized to alter, obscure or remove any proprietary information, copyright or logo from this Website in any way. If any of these rules are violated, it will be strongly protested and legal action will be taken.

Be the first to comment