
Examples of Frequency Distribution in Statistics
How to Make a Frequency Distribution Table: To make a frequency distribution table, Tally marks are often used.
The following are the steps to creating a frequency distribution table:
Step 1: First write the categories or class intervals in the first column.
Step 2: Next, tally the numbers in each category or class interval using tally marks.
Step 3: After that, count the tally marks and write the frequency in the last column. The frequency is simply the total.
[ Tally marks (or Hash marks) are defined using the system of unary numerals. They are a type of numeral that is used to count. They’re best for counting or tallying continuous results, like the score in a game or sport, because no intermediate results need to be rejected or erased.
Tally marks are usually written in a group of five lines. The first four lines are drawn vertically, while every fifth line runs diagonally over the first four lines, i.e. from the top of the first line to the bottom of the fourth line.
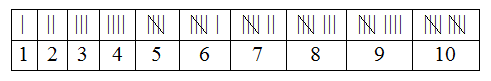
How to count Tally Marks: Tally marks are the quickest way to keep track of numbers in groups of five. To get the logic, look at the diagram below.
As you can see,
♦ The tally mark ‘|‘ is used to express the number 1.
♦ The tally mark ‘| |‘ is used to express the number 2.
♦ The tally mark ‘| | |‘ is used to express the number 3.
♦ The tally mark ‘| | | |‘ is used to express the number 4.
♦ But, the number 5 is not denoted by the tally marks ‘| | | | |’. We draw four vertical lines ( | | | | ) with a diagonal ( \ ) line through it for the number 5.]
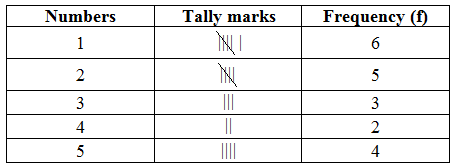
Question 1:- Construct a frequency distribution from the following data:
3, 5, 1, 4, 4, 1, 2, 5, 2, 2, 5, 2, 5, 1, 3, 1, 2, 1, 1, 3.
Solution:
To create a frequency distribution table, first, write the categories (numbers) in the first column. Next, tally the numbers in each category using tally marks. After that, count the tally marks and write the frequency in the last column. The frequency is simply the total, for example, we have six tally marks for the number “1”, so put 6 in the last column.
Frequency Distribution
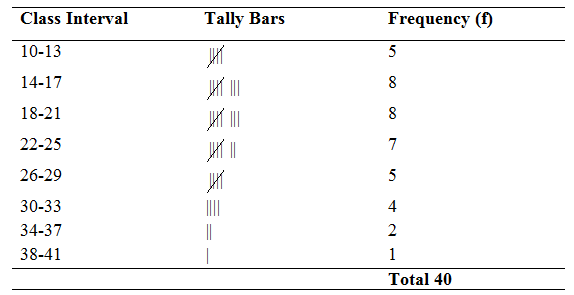
Question 2:- Construct a frequency distribution from the following data by inclusive method taking 4 as the class interval:
|
10 |
17 | 15 | 22 | 11 | 16 | 19 | 24 | 29 | 18 |
|
25 |
26 | 32 | 14 | 17 | 20 | 23 | 27 | 30 | 12 |
| 15 | 18 | 24 | 36 | 18 | 15 | 21 | 28 | 33 |
38 |
| 34 | 13 | 10 | 16 | 20 | 22 | 29 | 19 | 23 |
31 |
Solution:
Because the minimum value of the variable is 10 which is a very convenient figure for taking the lower limit of the first class and the magnitude of the class interval is given to be 4, the classes for preparing frequency distribution by the Inclusive Method will be 10-13, 14-17, 18-21, 22-25, …, 38-41.
Frequency Distribution
Question 3:- Prepare a statistical table from the following:
Weekly wages (Rs.) of 100 workers of Factory A
|
88 |
23 | 27 | 28 | 86 | 96 | 94 | 93 | 86 | 99 |
|
82 |
24 | 24 | 55 | 88 | 99 | 55 | 86 | 82 | 36 |
| 96 | 39 | 26 | 54 | 87 | 100 | 56 | 84 | 83 |
46 |
|
102 |
48 | 27 | 26 | 29 | 100 | 59 | 83 | 84 | 48 |
| 104 | 46 | 30 | 29 | 40 | 101 | 60 | 89 | 46 |
49 |
|
106 |
33 | 36 | 30 | 40 | 103 | 70 | 90 | 49 | 50 |
| 104 | 36 | 37 | 40 | 40 | 106 | 72 | 94 | 50 |
60 |
|
24 |
39 | 49 | 46 | 66 | 107 | 76 | 96 | 46 | 67 |
| 26 | 78 | 50 | 44 | 43 | 46 | 79 | 99 | 36 |
68 |
| 29 | 67 | 56 | 99 | 93 | 48 | 80 | 102 | 32 |
51 |
Solution: The lowest value is 23 and the highest is 106. The difference in the lowest and highest value is 83. If we take a class interval of 10, nine classes would be made. The first class should be taken as 20-30 instead of 23-33 as per the guidelines of classification.
Frequency Distribution of the Weekly wages (Rs.) of 100 workers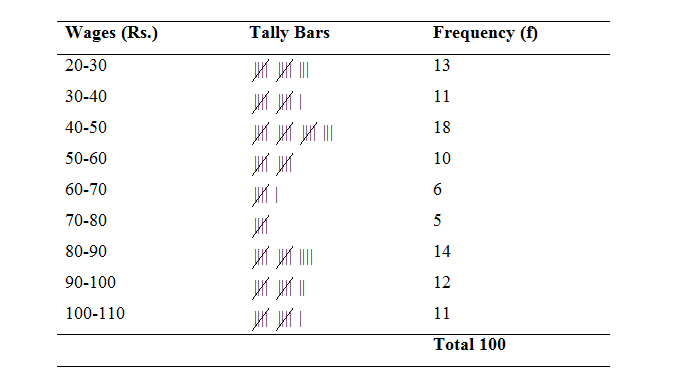
(Source – Various books from the college library)
Copyrighted Material © 2019 - 2024 Prinsli.com - All rights reserved
All content on this website is copyrighted. It is prohibited to copy, publish or distribute the content and images of this website through any website, book, newspaper, software, videos, YouTube Channel or any other medium without written permission. You are not authorized to alter, obscure or remove any proprietary information, copyright or logo from this Website in any way. If any of these rules are violated, it will be strongly protested and legal action will be taken.

Be the first to comment